Cryptocurrency Mining Analytics Dashboard
2022-10-15
I've been mining Etherium on my desktop PC for about a year now, using a Nvidia 1080 Ti I bought used for gaming. The income is modest, but is a good stream of beer money. Etherium is now moving towards a staking system, and so my mining era is concluded but it was a good run.
I've setup an analytics dashboard, and have been collecting metrics from the GPU and the mining pool since starting.
I wanted a better way to track costs related to power consumption, and calculate profitability. What started as a simple monitoring need turned into a full-fledged analytics pipeline that taught me a lot about data engineering and visualization.
The analytics stack runs on my home server, seperate from the mining PC.
This tutorial walks through setting up the monitoring and analytics stack; Prometheus, Grafana, and exporters. Setting up Docker and mining software is out of scope for this tutorial.
The Problem and Initial Planning
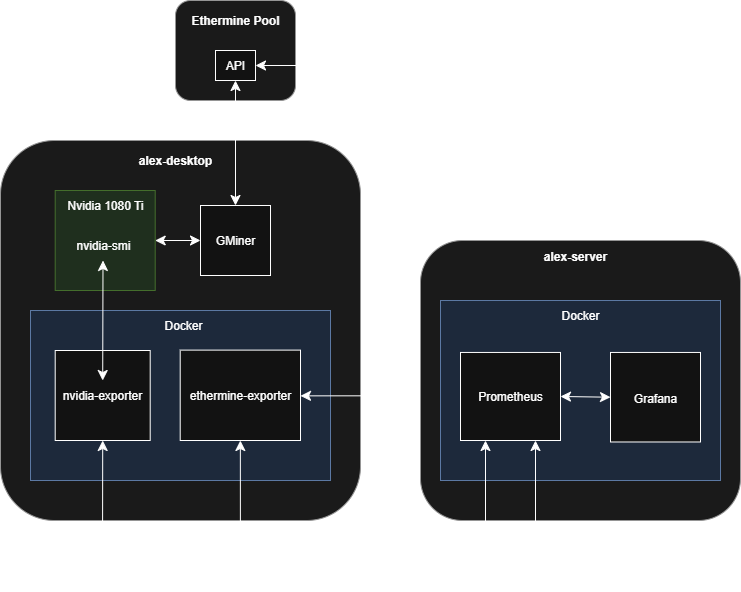
Mining operations generate data from multiple sources that don't naturally talk to each other. Your GPUs are reporting power consumption and temperatures through nvidia-smi, while your mining pool tracks hashrates and earnings on their web interface.
I needed a solution that could collect metrics from different sources, store them reliably, and present everything in dashboards that make sense for both quick health checks and deeper analysis. After evaluating several options, I settled on the Prometheus ecosystem because it's designed specifically for time-series monitoring and has excellent tooling around it.
The architecture ended up being fairly straightforward: exporters collect metrics and expose them via HTTP endpoints, Prometheus scrapes those endpoints and stores the data, and Grafana queries Prometheus to build dashboards. Docker Compose orchestrates everything and handles service discovery automatically.
Project File Structure
Server
crypto-mining-dashboard/
├── compose.yam
├── prometheus/
│   └── config/
│       └── prometheus.yml
├── grafana/
│   └── config/
│       └── datasources.yml
Desktop
data-exporters/
├── compose.yaml
Building the Data Pipeline
Prometheus Database
"Prometheus is an open-source systems monitoring and alerting toolkit originally built at SoundCloud."
"Prometheus collects and stores its metrics as time series data, i.e. metrics information is stored with the timestamp at which it was recorded, alongside optional key-value pairs called labels."
Prometheus is optimized for storing time-series data, meant to be used for streaming metrics and analytics. It's works will with Grafana.
The following is the compose.yaml file
services:
  prometheus:
    image: prom/prometheus
    container_name: prometheus
    restart: unless-stopped
    command:
      - '--storage.tsdb.retention.time=5y'
    ports:
      - 9090:9090
    volumes:
      - ./prometheus/config:/etc/prometheus
      - prometheus_data:/prometheus

volumes:
  prometheus_data:
- Set a retention period of 5 years. The defualt is 15 days, so I'll specify something longer so I can track historical data.
- Map the
/etc/prometheusfolder so we specify aprometheus.ymlfile later to configure data sources.
Grafana Dashboard
Grafana is an open-source platform for monitoring and observability, we'll be using it to create our dashboards.
services:
  grafana:
    image: grafana/grafana-enterprise
    container_name: grafana
    restart: unless-stopped
    ports:
      - 3000:3000
    environment:
      - GF_SECURITY_ADMIN_USER=admin
      - GF_SECURITY_ADMIN_PASSWORD=grafana
    volumes:
      - ./grafana/config:/etc/grafana/provisioning/datasources
      - grafana_data:/var/lib/grafana

volumes:
  grafana_data:
- Set a username and password for the dashboard
- Map the
/etc/grafana/provisioning/datasourcesfolder so we specify adatasources.ymlfile. We'll be specifying the Prometheus instance as the datasource.
datasources:
  - name: Prometheus
    type: prometheus
    access: proxy
    url: http://prometheus:9090
    isDefault: true
    editable: true
Data Exporters
I'm using utkuozdemir/nvidia_gpu_exporter to collect analytics from the Nvidia GPU, to measure things likes power consumption. This custom exporter connects to the nvidia-smi tool provided by the standard Nvidia driver.
To expose the Nvidia GPU from the host inside of the docker container, setup NVIDIA Container Toolkit
services:
  nvidia-gpu-exporter:
    image: utkuozdemir/nvidia_gpu_exporter
    container_name: nvidia-gpu-exporter
    restart: unless-stopped
    ports:
      - 9835:9835
    deploy:
      resources:
        reservations:
          devices:
            - driver: nvidia
              count: all
              capabilities: [gpu]
    environment:
      - NVIDIA_VISIBLE_DEVICES=all
Nvidia provides their own Prometheus exporter dcgm-exporter, NVIDIA Data Center GPU Manager (DCGM) is targeted more at enterprise use. It is more complicated to setup than the custom exporter, and actually reports less metrics than the nvidia-smi based exporter.
I'm using hon95/prometheus-ethermine-exporter to collect analytic from the ethermine etherium mining pool.
services:
  ethermine-exporter:
    image: hon95/prometheus-ethermine-exporter
    environment:
      - TZ=America/Toronto
    ports:
      - 8080:8080
In my instance the data exporters are running on mining system itself. This is a seperate host than where the Prometheus and Grafana contianers are running.
Configuring prometheus.yml
We'll need to specify a configurtation file for Prometheus to scrape data from the exporters.
global:
  scrape_interval: 60s
  scrape_timeout: 10s

scrape_configs:
  - job_name: 'prometheus'
    static_configs:
      - targets: ['prometheus:9090']

  - job_name: 'nvidia-gpu-exporter'
    static_configs:
      - targets: ['alex-desktop:9835']

  - job_name: ethermine-ethermine-miner
    # Limit due to API rate restriction
    scrape_interval: 5m
    metrics_path: /miner
    params:
      pool: [ethermine]
    static_configs:
      - targets:
          # TODO List your ETH addresses here
          - 0000000000000000000000000000000000000000
    relabel_configs:
      - source_labels: [__address__]
        target_label: __param_target
      - source_labels: [__param_target]
        target_label: instance
      - target_label: __address__
        # TODO Point this to your exporter
        replacement: alex-desktop:8080
Validate Setup
Visit http://server-ip:9090/targets to verfiy that Prometheus can reach the the exporters.
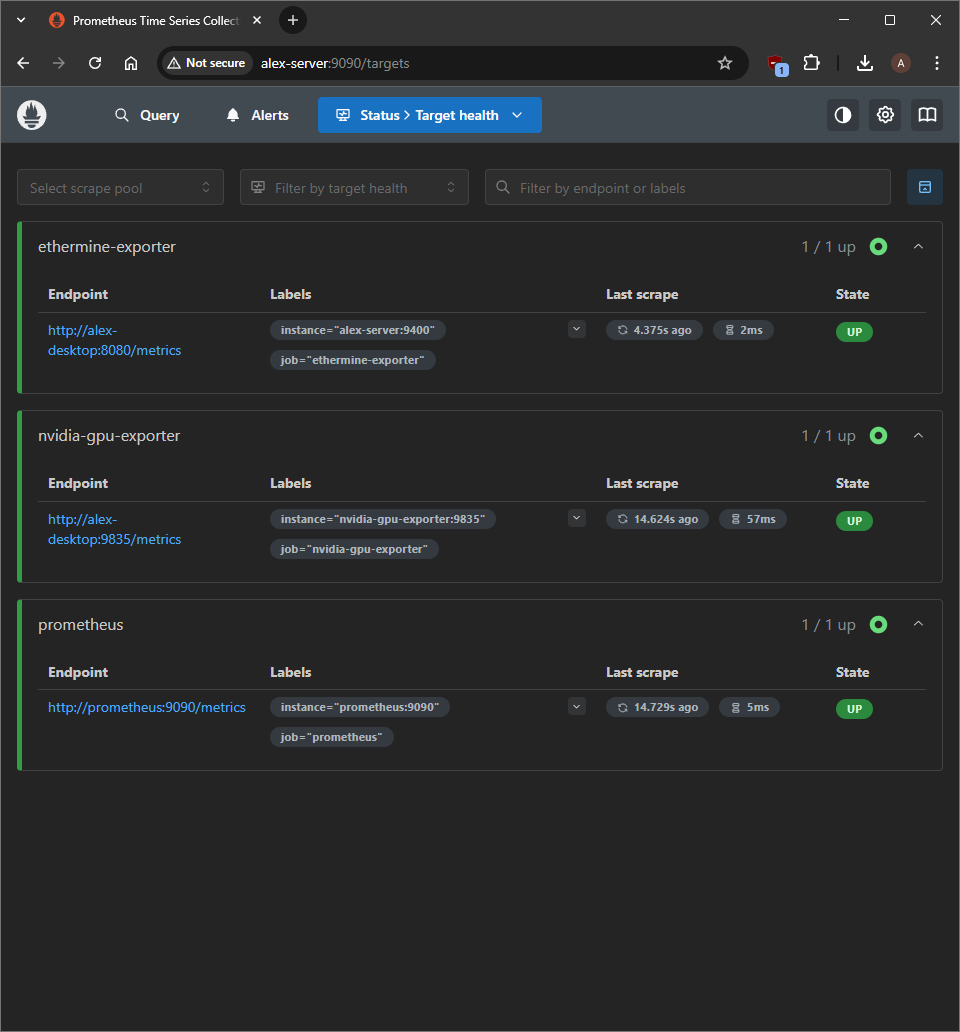
The targets page shows all exporters as "UP" with recent successful scrapes, indicating the data pipeline is functioning correctly.
Go to the Query tab and see that data is flowing into Prometheus.
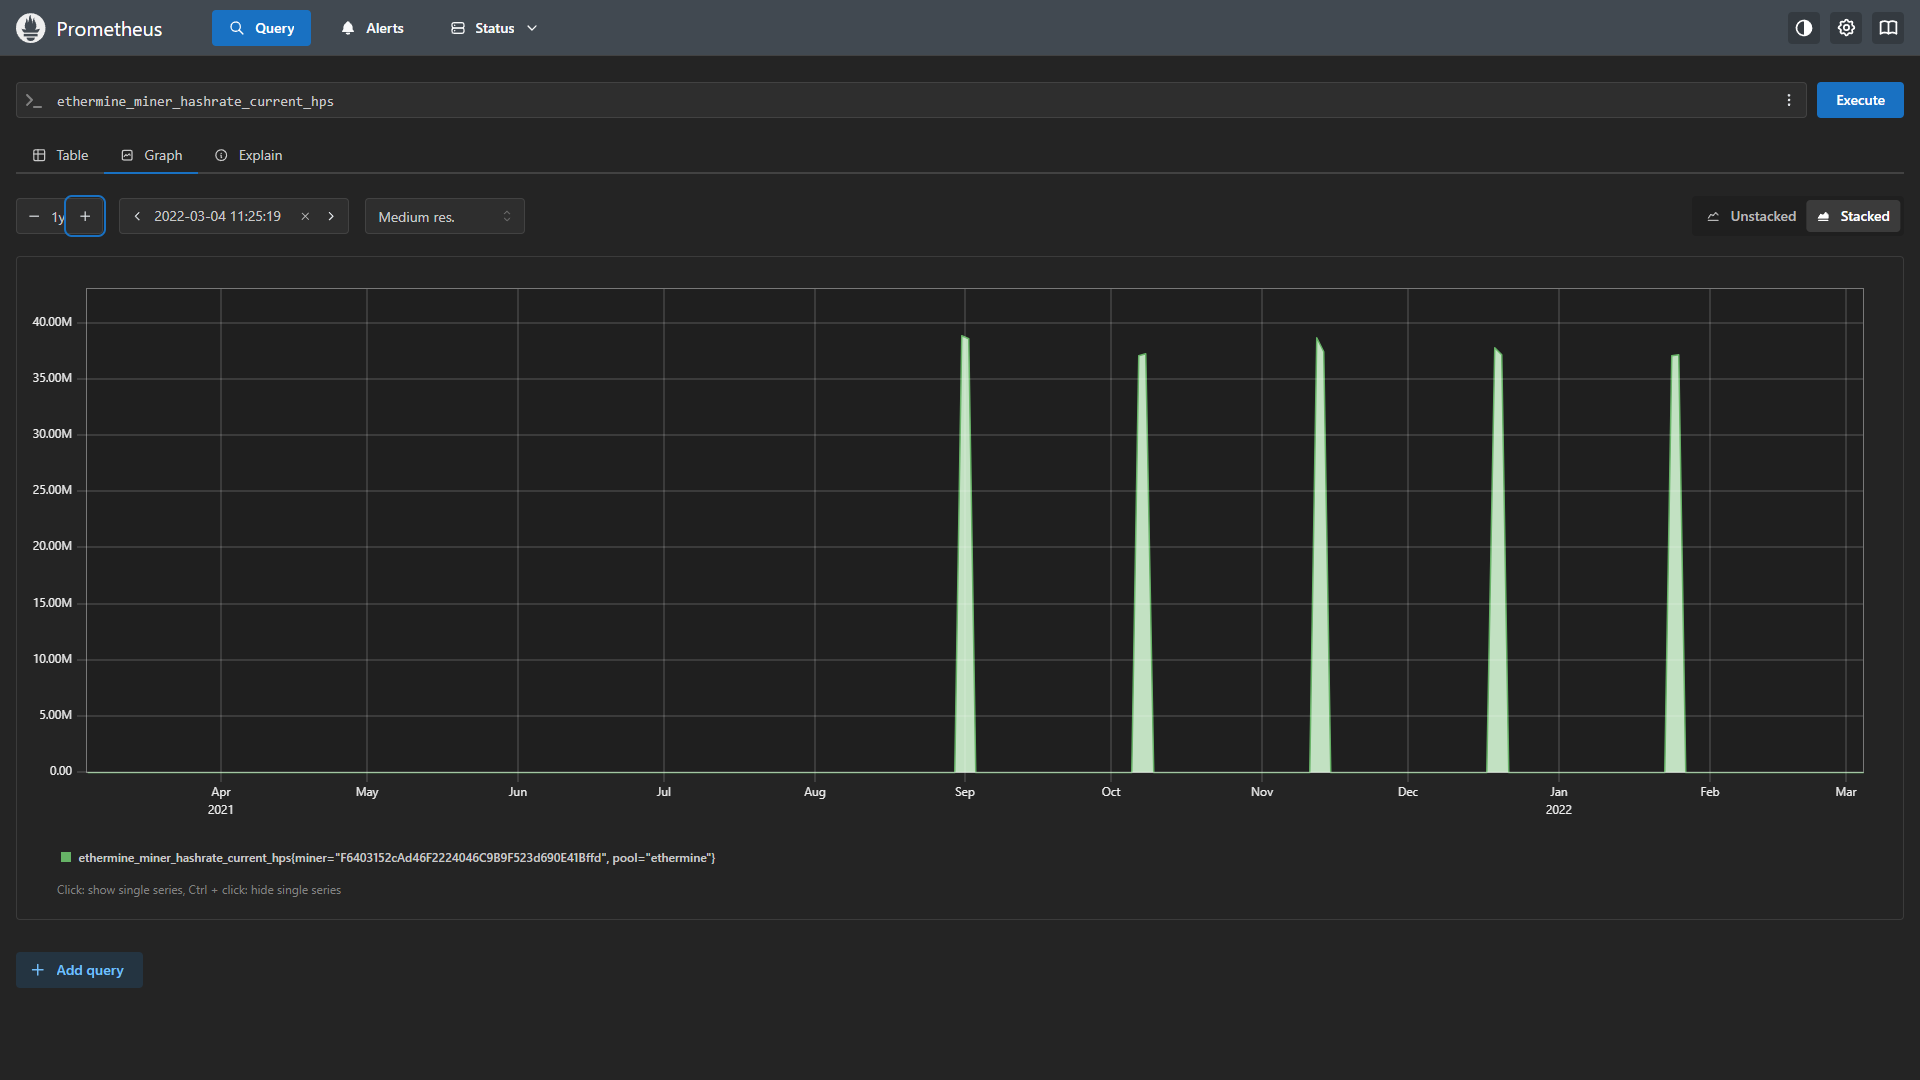
The Prometheus query interface enables ad-hoc analysis for troubleshooting and optimization. This useful for exploring different data metrics before building out vizualizations.
I've setup a simple dashboard to display the GPU hashrate, power consumption, valid shares, and unpaid balance.
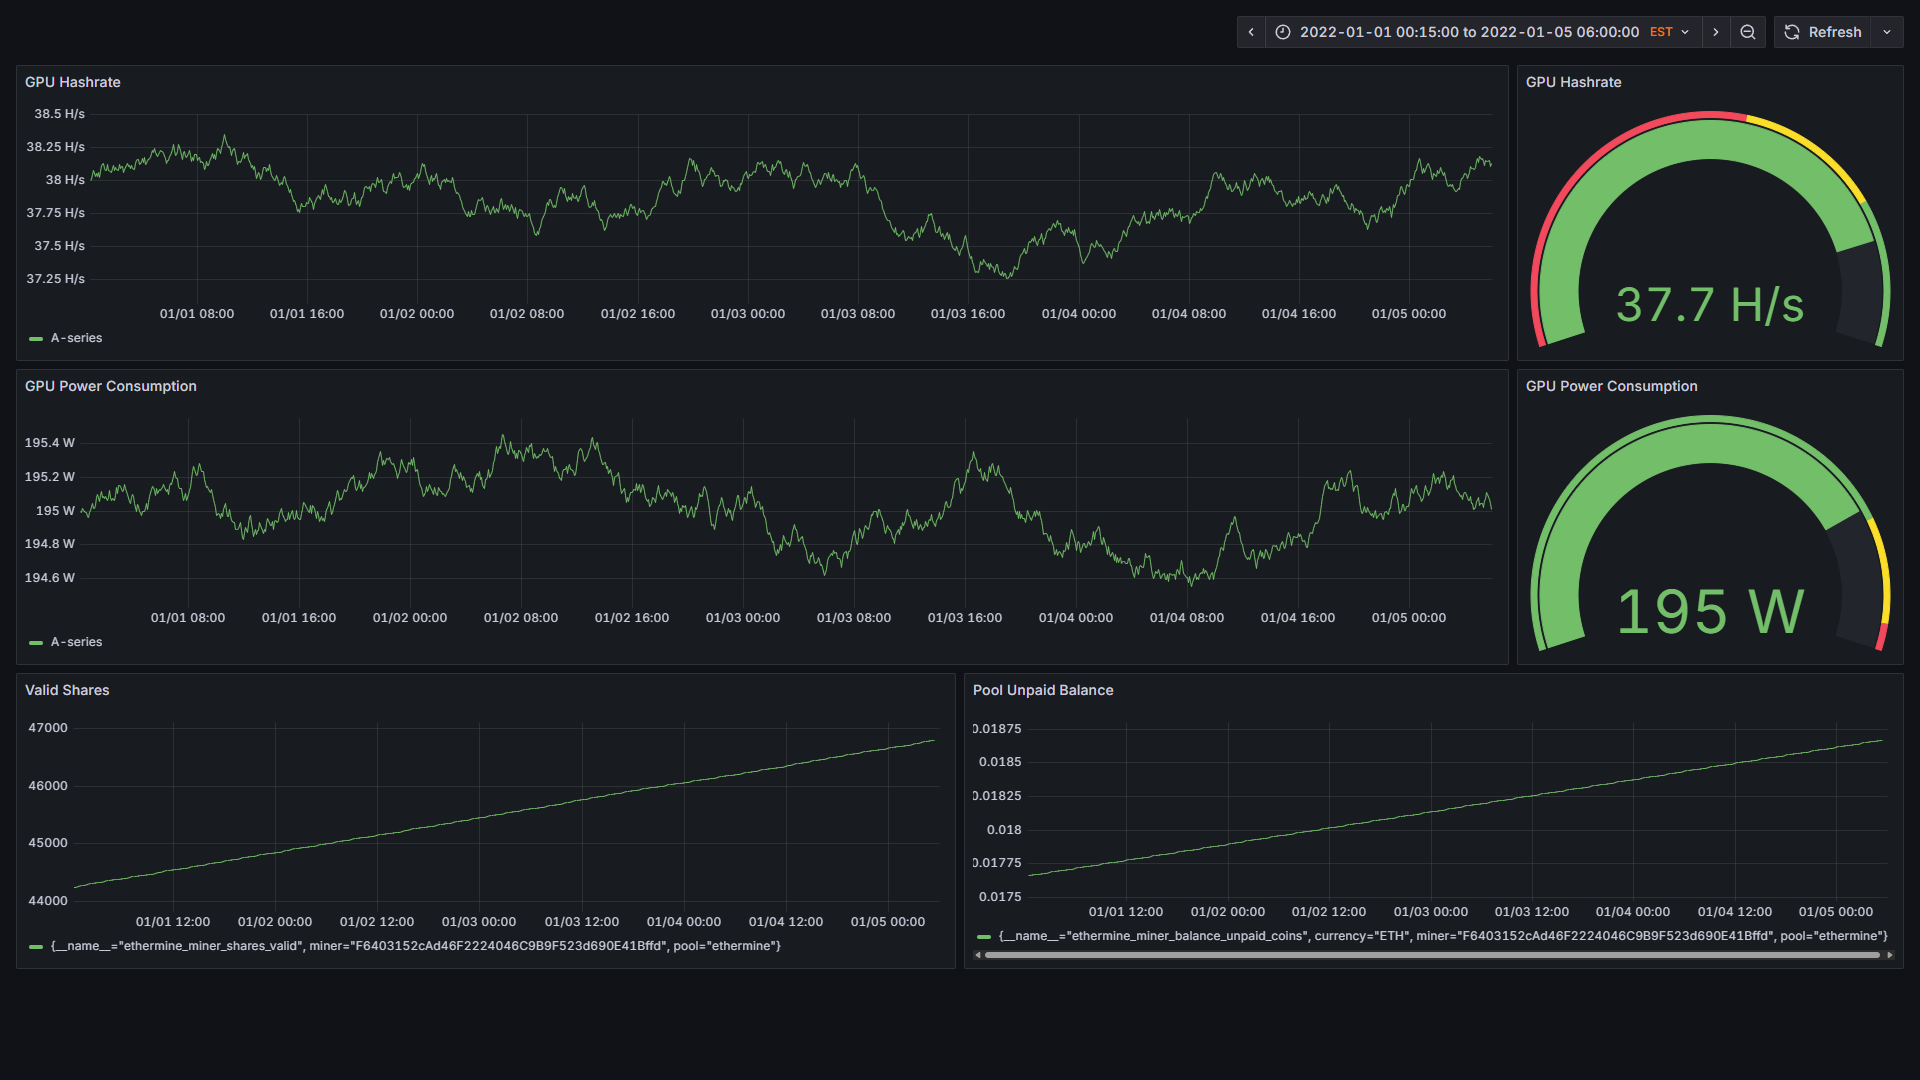
The dashboard demonstrates several design principles that emerged during development. The gauge visualizations provide immediate status awareness with color coding for normal, warning, and critical states. The time-series graphs reveal trends over several days, which proved essential for identifying gradual degradation or improvement patterns.
Having GPU metrics and pool statistics on the same dashboard allows quick correlation between equipment performance and earnings. The steady trends in both hashrate and power consumption indicate consistent mining operation.
Through Data Analysis and Performance Optimization
The most rewarding aspect of this project was using the collected data to optimize mining operations. The correlation between power consumption and hashrate revealed optimal operating points that weren't obvious. The data showed that running the 1080 Ti at slightly reduced power limits often provided better efficiency without significantly impacting output.
Lessons Learned
Building this monitoring system taught valuable lessons about data pipeline design and operations. Starting with simple, reliable components and gradually adding complexity worked better than trying to build everything at once. The Docker Compose approach provided good isolation and reproducibility, making the system easy to replicate or modify.
This project demonstrated how comprehensive monitoring transforms operations from reactive maintenance to proactive optimization. The investment in building robust data collection and analysis capabilities pays dividends through improved efficiency, reduced downtime, and better decision-making based on actual performance data rather than assumptions.